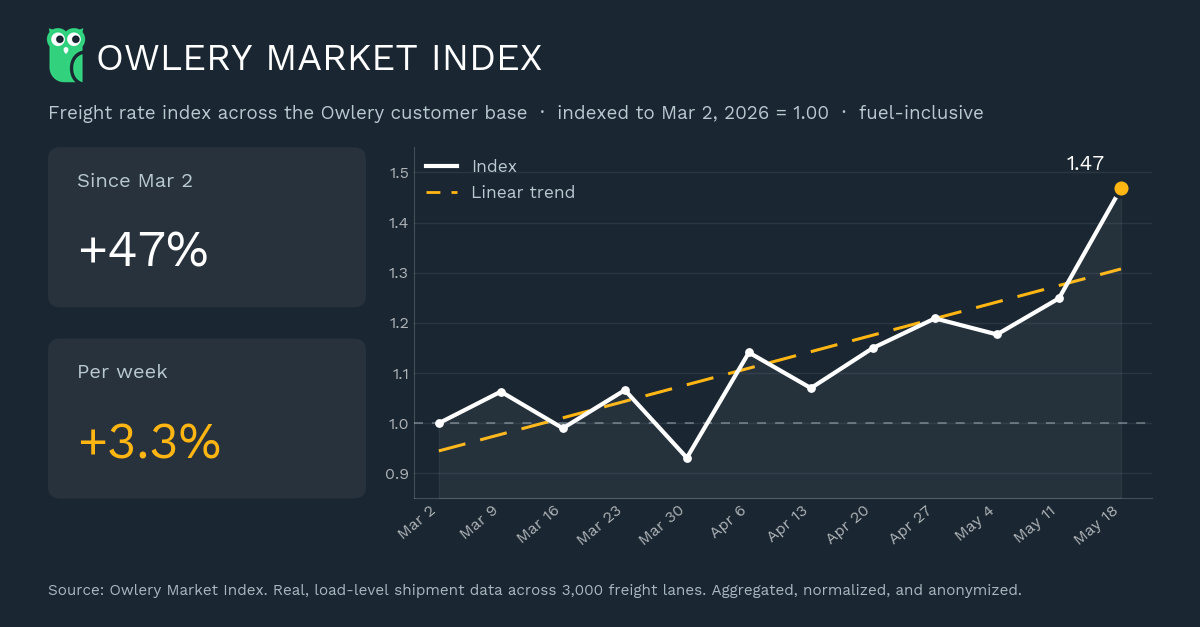
The freight market is tightening, and our data shows it clearly from the inside. The Owlery Market Index, a fuel-inclusive freight rate index built from real shipment data across roughly 3,000 lanes, is up 47% since March 2, 2026. That's an average climb of about 3.3% per week for twelve straight weeks. Rates aren't drifting up. They're compounding.
If you manage freight, this matters whether you ship dry van, reefer, or a mix of modes. A tightening market changes what you pay, which carriers actually show up, and how much warning you get before a budget blows past plan. The shippers who come out ahead aren't the ones who react fastest. They're the ones who saw it coming.
What Is the Owlery Market Index?
The Owlery Market Index is a freight rate benchmark drawn from actual loads moving across the Owlery customer base, normalized and anonymized. It's indexed so that March 2, 2026 equals 1.00 and it is fuel inclusive, so it tracks the all-in cost a shipper might pay. As of March 24, the latest reading it sits at 1.47.
The point of an index like this is honesty. It isn't a forecast or a survey of how people feel about capacity. It's a measure of what real freight actually cost, lane by lane, week over week.
Is the Freight Market Really Tightening?
Yes, and the shape of the curve is the part worth paying attention to. A 47% rise on its own is a headline. A steady 3.3% weekly climb is a trend with momentum behind it. Small weekly increases compound, the same way interest does, which is how twelve modest-looking weeks turned into a 47% jump.
When rates move like this, it usually means capacity is getting harder to find. Carriers have more freight to choose from, so they hold firmer on price and walk away from loads that don't pay. That dynamic shows up in the numbers before it shows up in your inbox.
How Do You Know the Freight Market Is Tightening?
The index is the summary. The warning signs are what you feel in daily operations. When the market tightens, four things tend to happen at once.
Tender rejections climb
The first crack is usually your routing guide. Carriers you've relied on start declining loads they used to accept, and you fall further down the waterfall to backups that cost more. A rising rejection rate is one of the earliest signals that capacity is leaving the market.
Spot rates jump
When contracted carriers say no, you land on the spot market, and in a tightening cycle that's exactly when spot rates spike. Shippers who lean on the spot market without watching it closely can absorb large, unplanned cost increases load by load.
Fuel creeps up
Fuel is often the quietest part of a freight bill and the easiest to overpay. When the index is fuel-inclusive, a rising fuel component lifts your all-in cost even if linehaul holds steady. If you can't see fuel broken out from linehaul, you can't tell whether you're negotiating on real cost or just paying whatever the surcharge schedule says.
Contracts start to bend
In the sharpest markets, contract rates stop holding. We've seen a carrier walk away from agreed contract pricing mid-agreement, which leaves the shipper scrambling for coverage at spot rates with no notice. Manual tracking vs. real-time monitoring is the difference between catching that the day it happens and catching it on the invoice three weeks later.
What Happens to Shippers Who Don't See It Coming?
The real danger in a tightening freight market isn't paying more. Higher rates are survivable when you plan for them. The danger is not knowing until it's too late to do anything about it.
A shipper running freight out of spreadsheets and email finds out about a broken contract rate when the bill arrives. By then the load already moved, the budget variance is already locked in, and there's no chance to source backup capacity at a better price. A volatile market punishes the shippers who react and rewards the ones who anticipate. Visibility is what separates the two.
How Should Shippers Respond to a Tightening Freight Market?
You don't control the market. You do control how early you see it and how fast you can move. A few practices matter more than the rest when rates are climbing.
- Monitor your contract rates in real time. Know the day a rate breaks, not the day the invoice clears. Early warning is the whole game.
- Build backup capacity before you need it. Line up secondary carriers on your key lanes so a rejection becomes a quick reroute instead of a fire drill.
- Separate fuel from linehaul. Negotiate on the real underlying cost, and you'll catch surcharge creep that would otherwise hide inside your all-in rate.
- Watch your lanes individually. A blended average can look calm while specific lanes climb fast. Lane-level signal tells you where to focus before the pain spreads.
This is the gap Owlery is built to close. The same data feeding the Owlery Market Index powers real-time contract monitoring, fast backup capacity when carriers waver, fuel broken out from linehaul, and lane-level signal on what's climbing fastest, all from the actual rates we see across thousands of lanes rather than predictions.
The market will do what it does. Whether it costs you depends on how early you can see it move.
Frequently Asked Questions
What does it mean when the freight market is tightening?
How much have freight rates risen recently?
Why is fuel included in the index?
What's the biggest risk for shippers in a tightening market?
How can a TMS help during a tightening market?

Ready to make your supply chain team happy?
Start saving on freight and time in days—not months